Investment performance
The return on your investment depends on the performance of the investment option(s) you have chosen to invest in. Returns may be negative, nil or positive.
Daily unit pricing
Updated at the end of each trading day
Unit prices include fees but not tax. Read more about unit pricing.
Current prices
| After expenses but before tax | Current price 19/11/2025 |
|---|---|
| High Growth | $1.3212 |
| Growth | $1.8585 |
| Balanced | $1.6275 |
| Stable | $1.3756 |
| Cash Plus | $1.2553 |
Percentage returns for this scheme year
Updated monthly
These investment performance figures are based on the change in unit prices over a given period and are expressed as a percentage. Returns are after fees and before tax. Percentage returns on your investment will vary depending on your prescribed investor rate (PIR). Read more about tax.
High Growth % |
Growth % |
Balanced % |
Stable % |
Cash Plus % |
|
|
April 2025 |
-1.85 |
-1.23 |
-0.58 |
0.32 |
0.34 |
|
May 2025 |
4.77 |
3.76 |
2.77 |
0.90 |
0.27 |
|
June 2025 |
2.56 |
2.03 |
1.70 |
1.04 |
0.30 |
|
July 2025 |
2.22 |
1.80 |
1.41 |
0.64 |
0.29 |
|
August 2025 |
1.82 |
1.61 |
1.47 |
0.96 |
0.31 |
|
September 2025 |
3.93 |
3.24 |
2.62 |
1.41 |
0.30 |
|
October 2025 |
2.76 |
2.24 |
1.83 |
1.01 |
0.27 |
Year to date |
17.24 |
14.15 |
11.74 |
6.44 |
2.10 |
PSS performance vs KiwiSaver
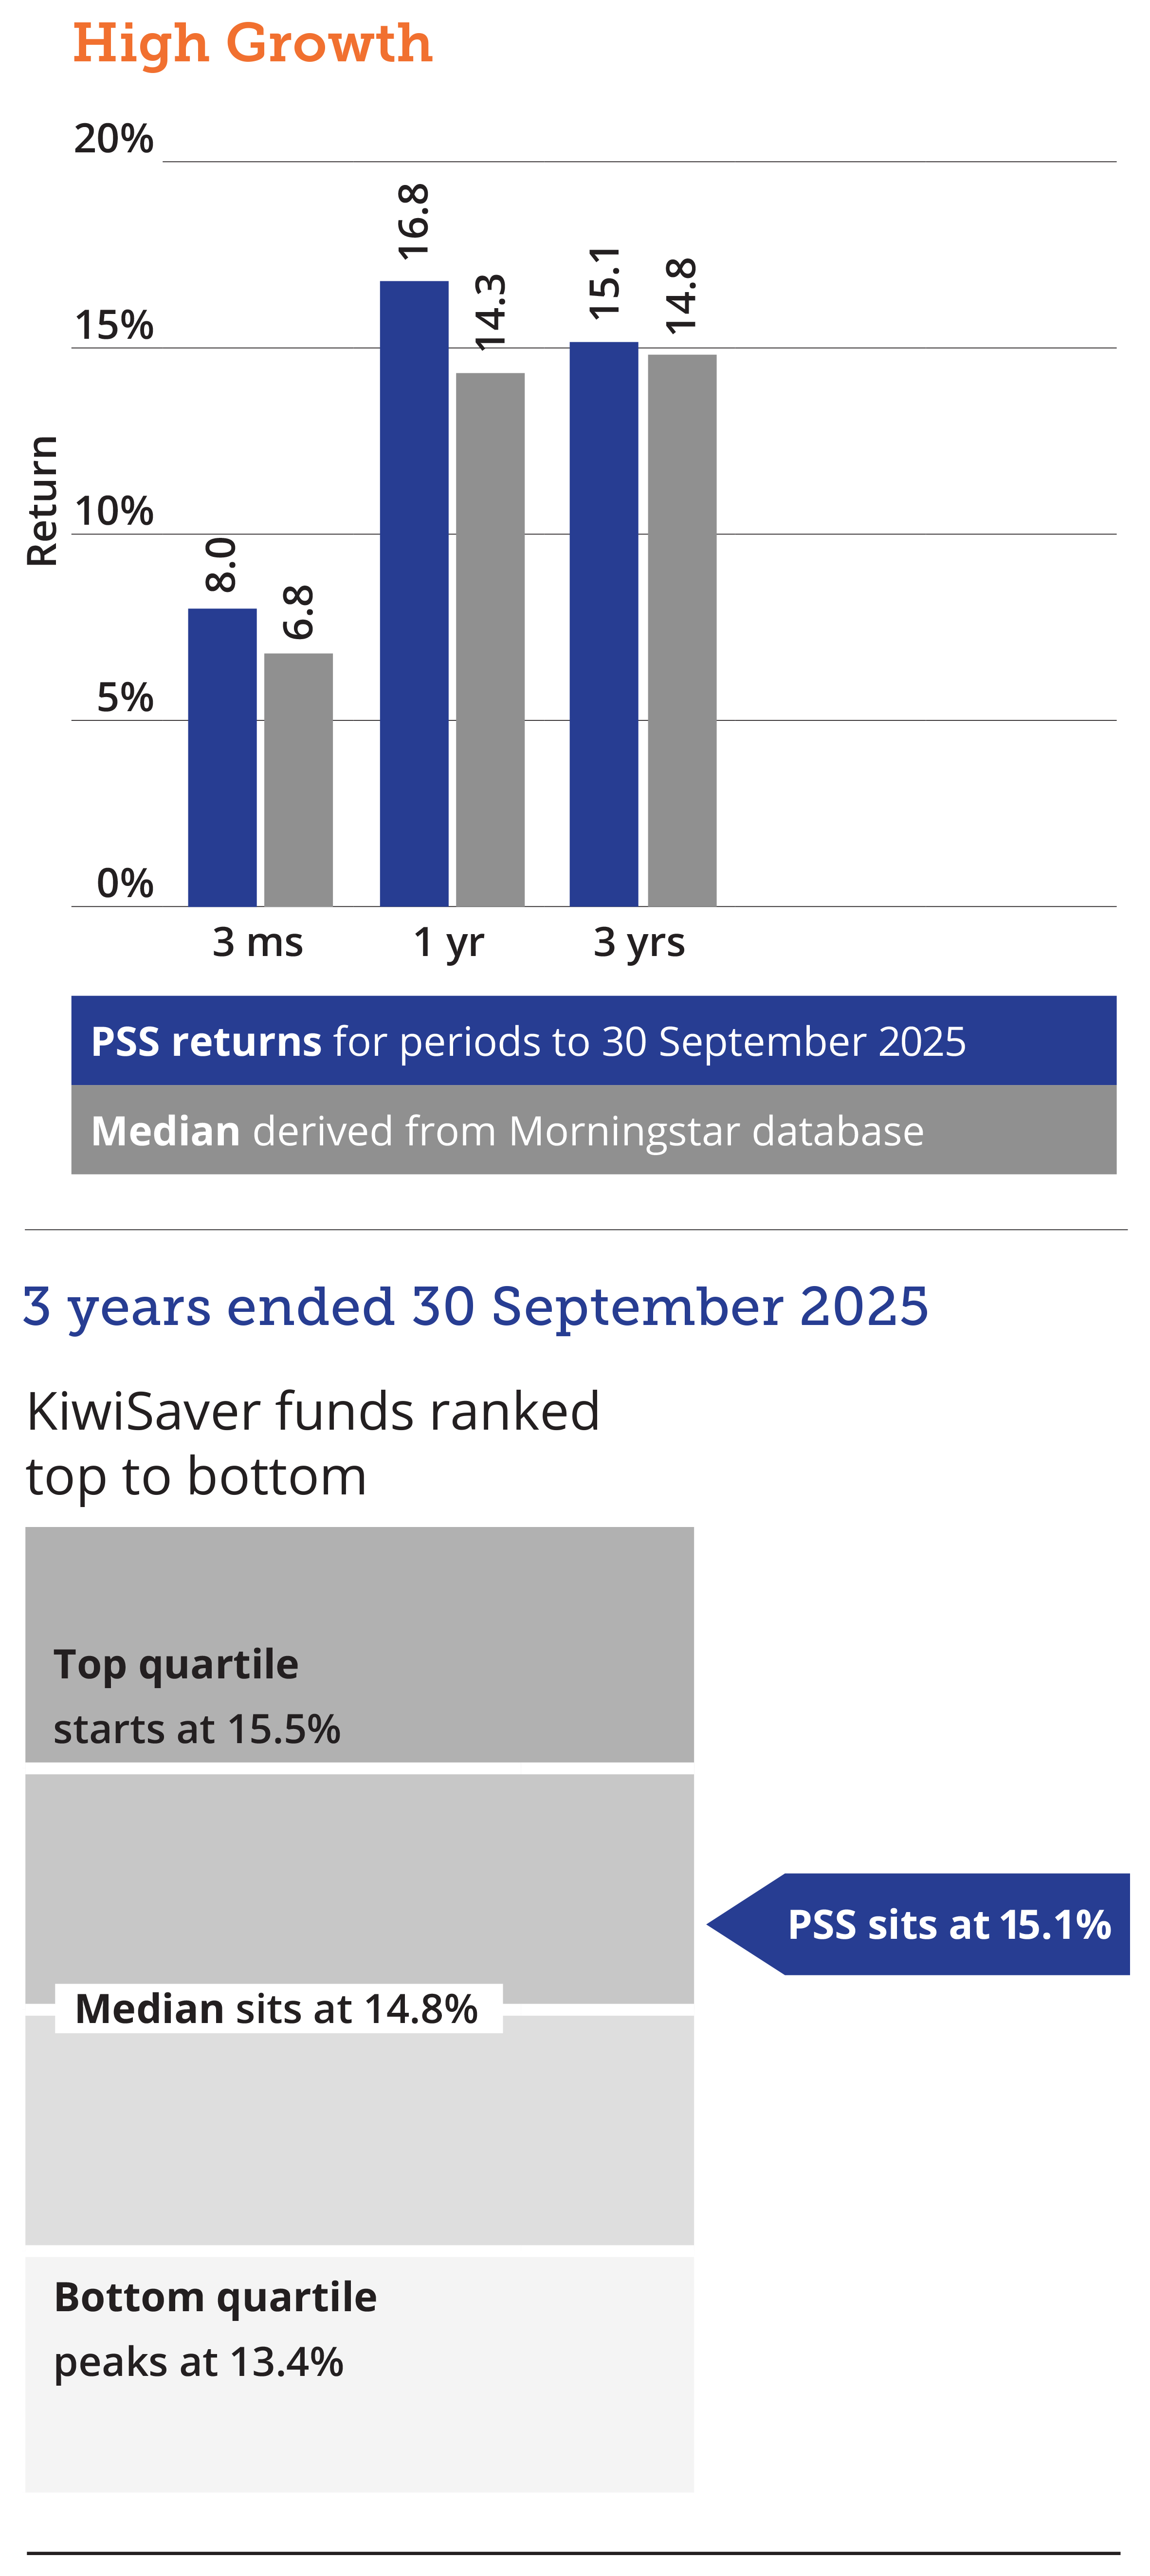
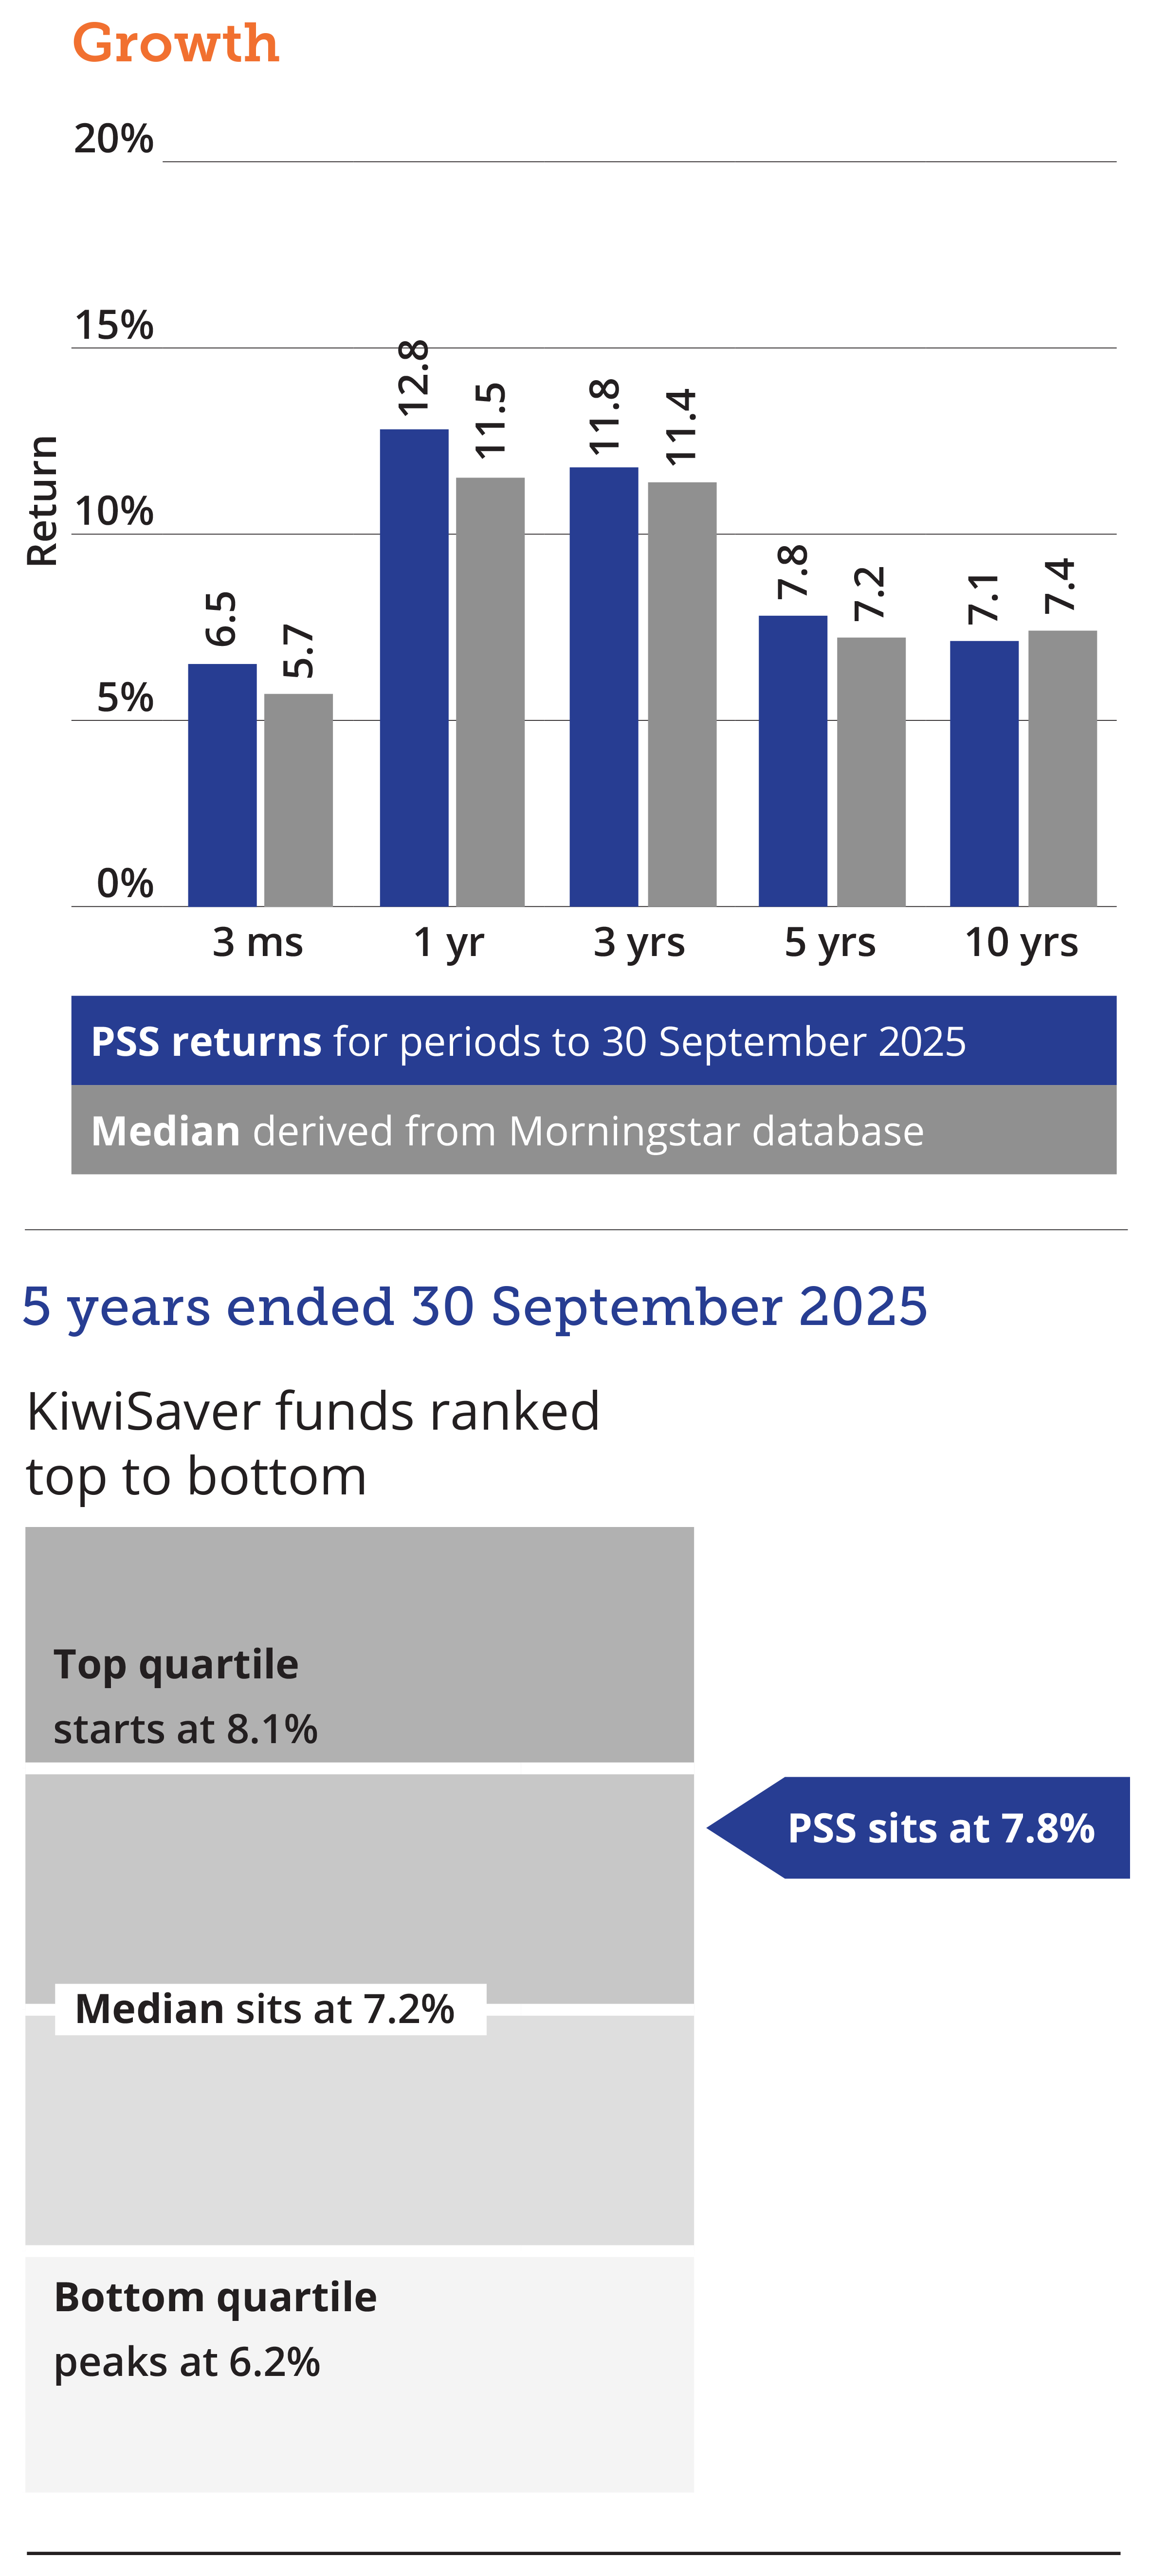
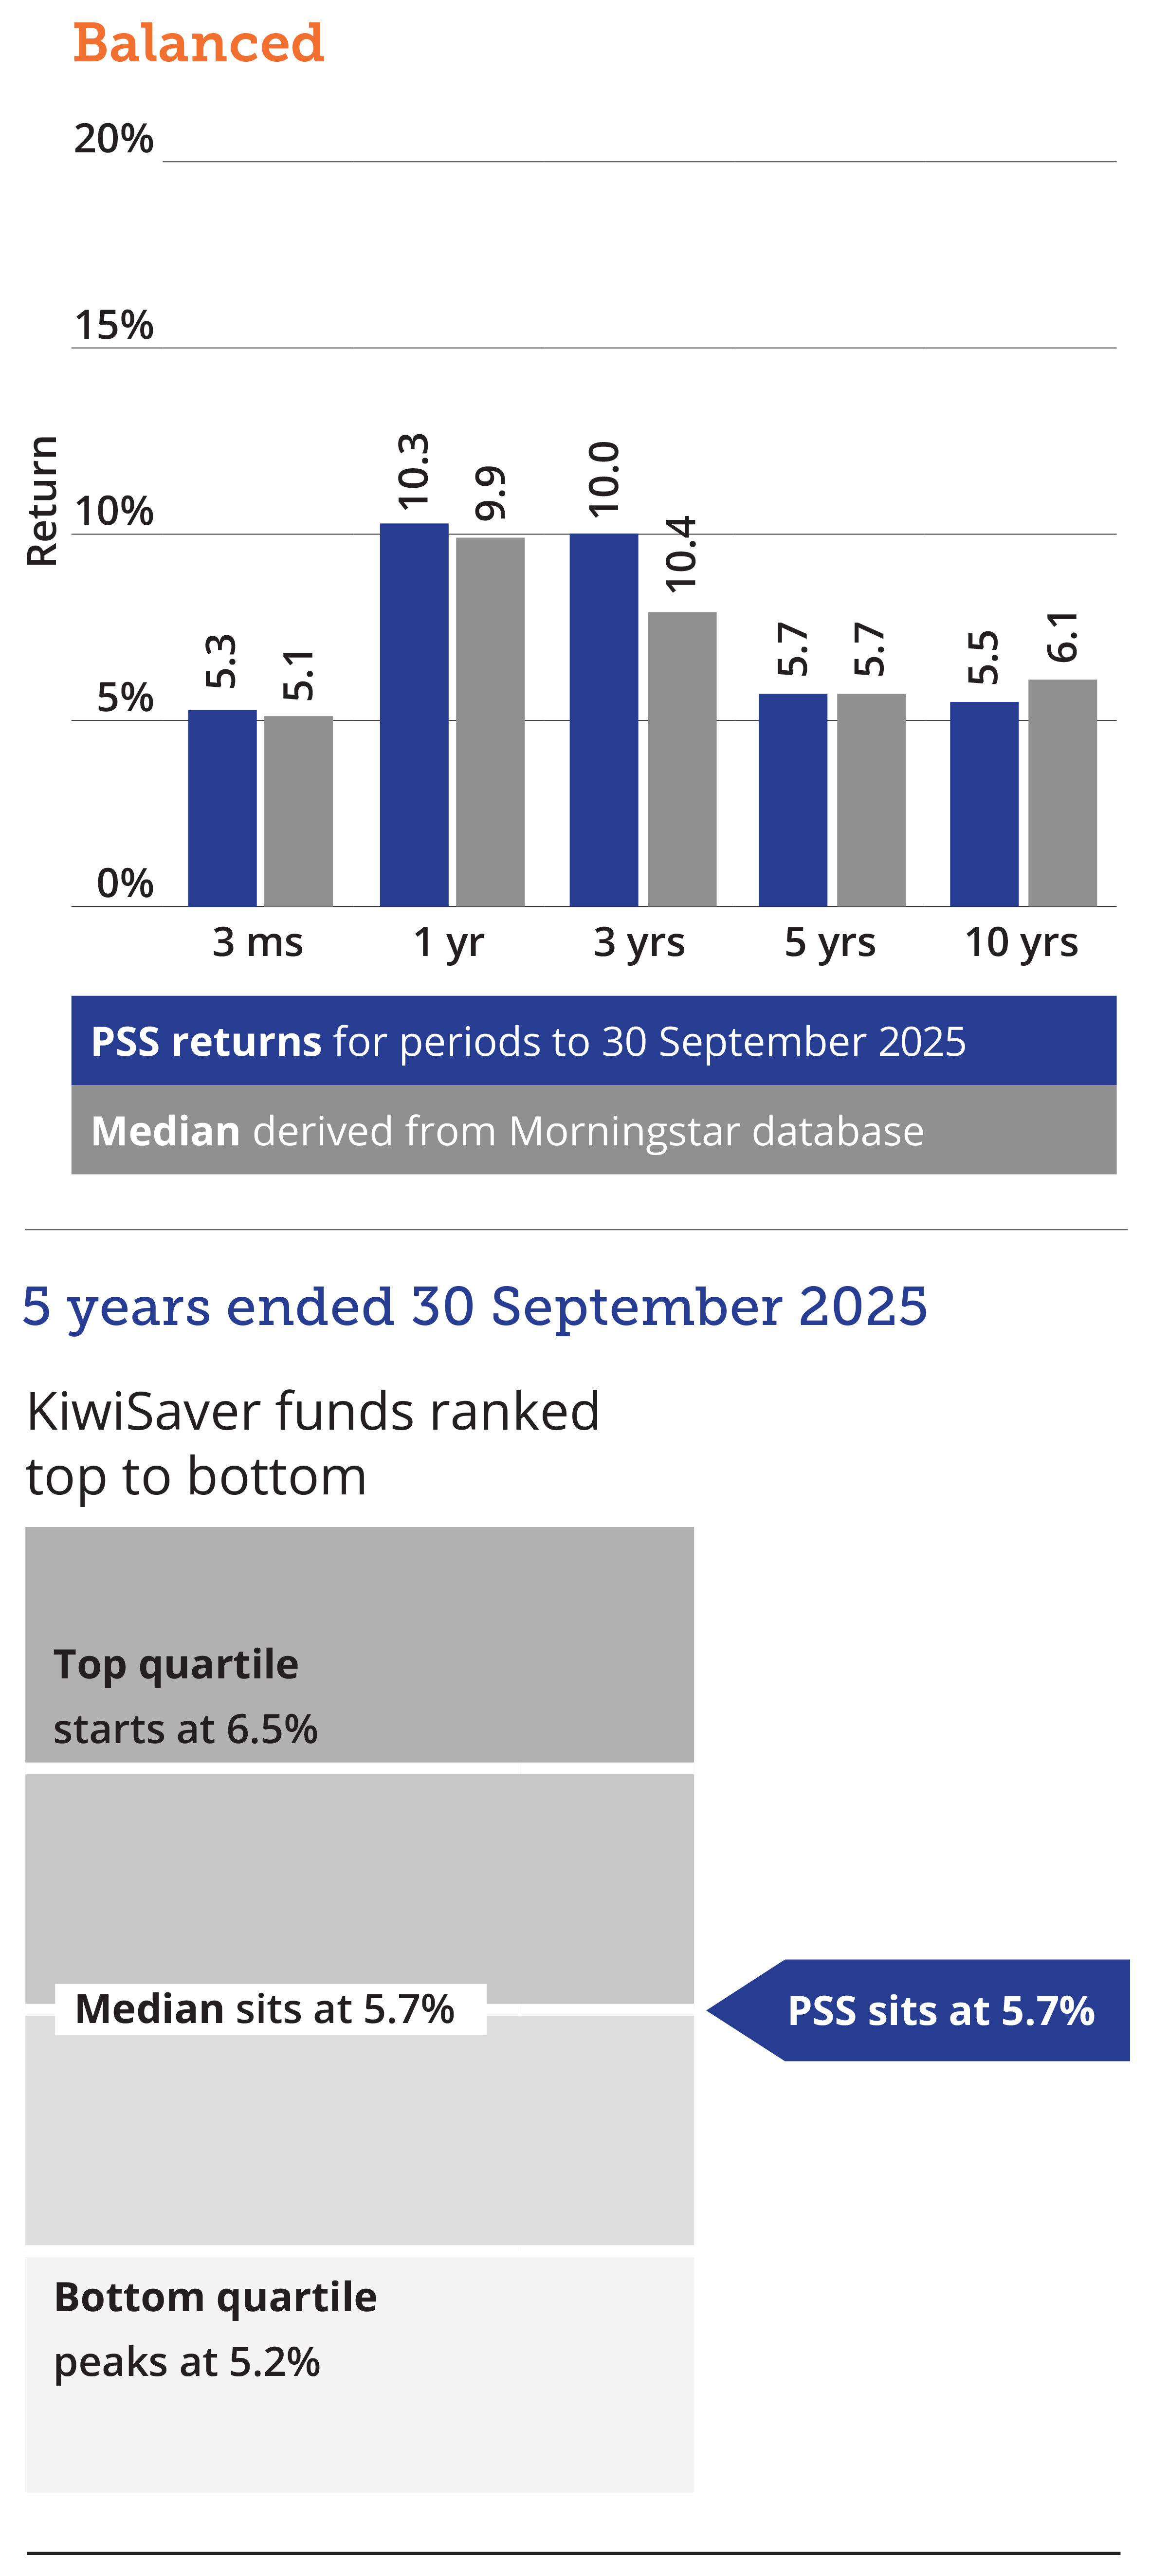
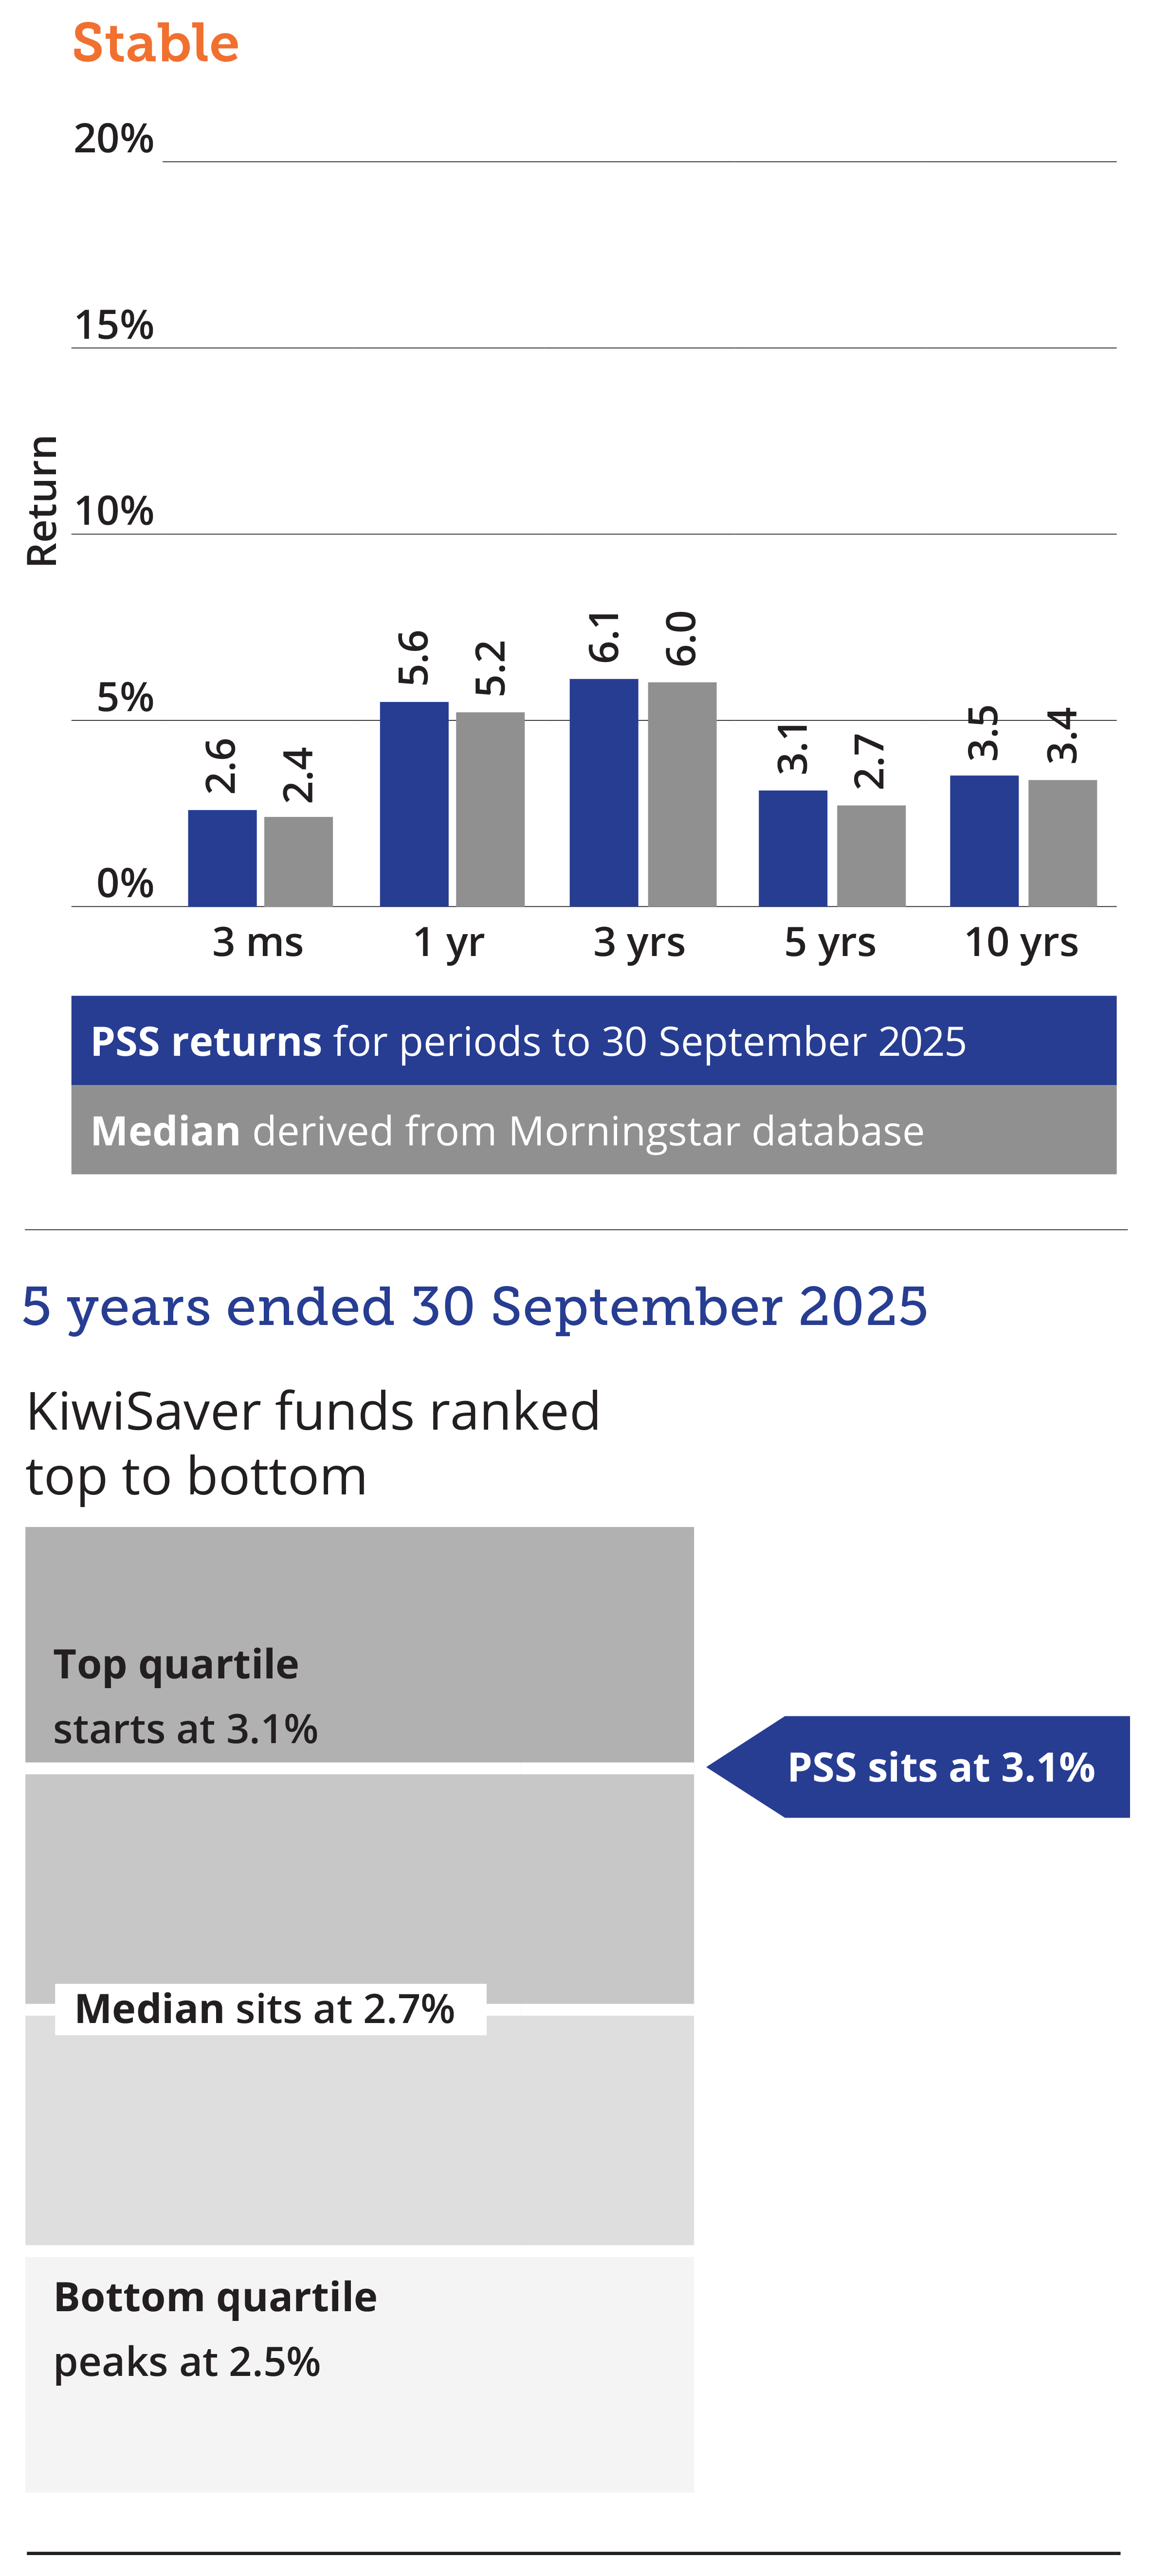
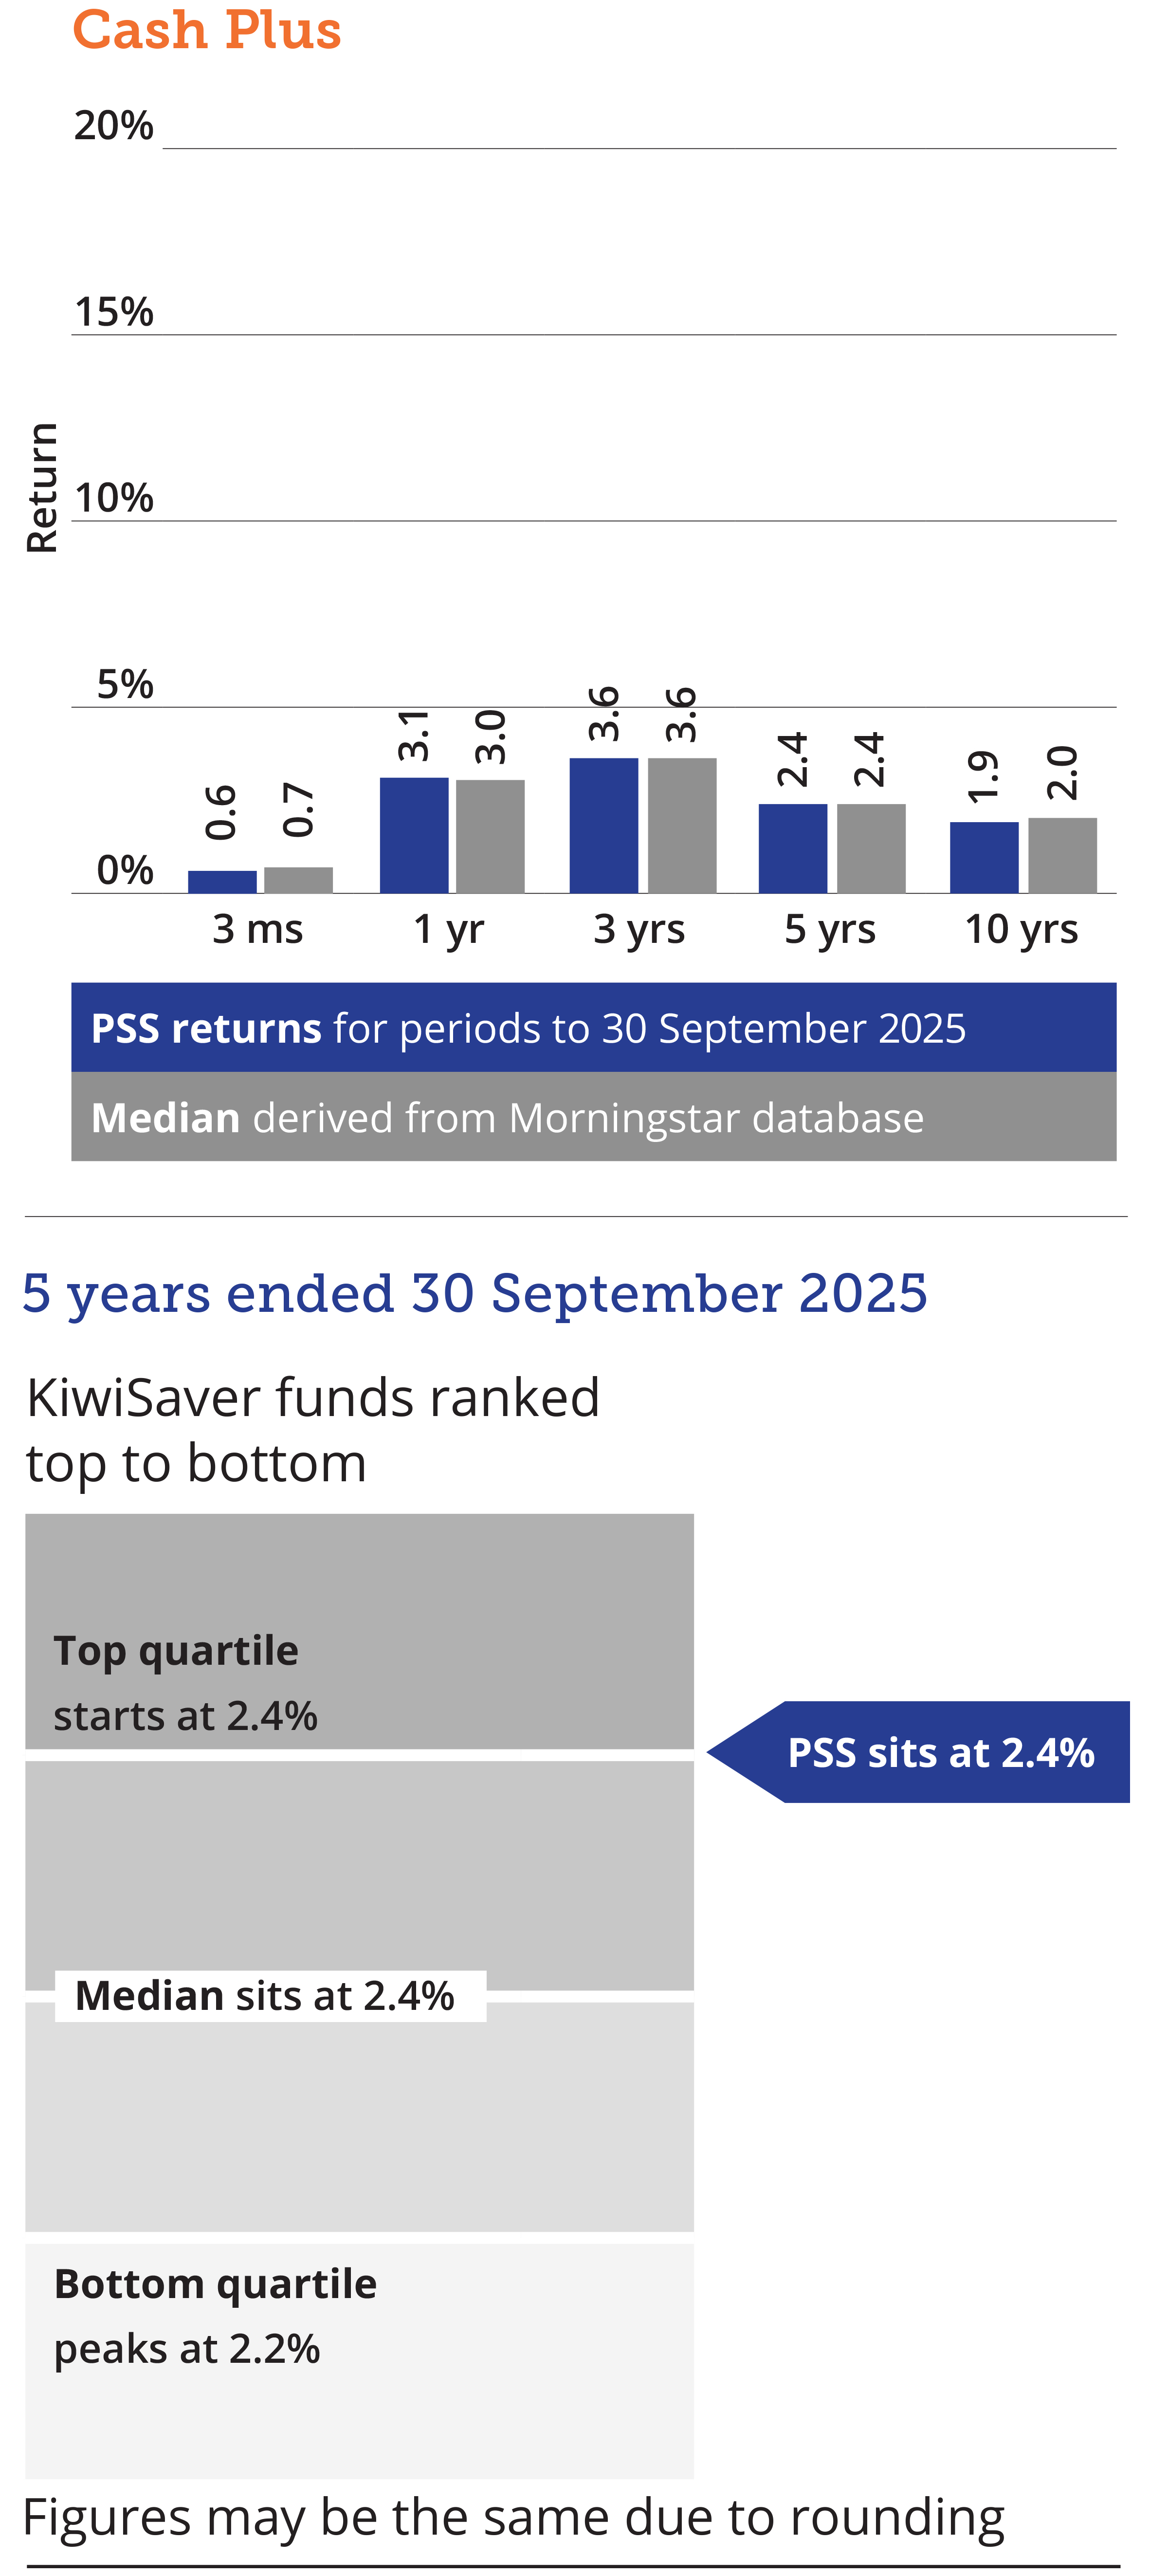
Comparative data derived from the Morningstar database. Morningstar is an independent company that monitors KiwiSaver fund performance.
While all care has been taken in the display of these fund performance figures, neither PSS Trustees Limited nor any other person accepts responsibility for any errors. The returns are not the returns individual PSS or KiwiSaver members would have received as this depends on the prices at which units are purchased on the date that contributions were received for each PSS or KiwiSaver member.
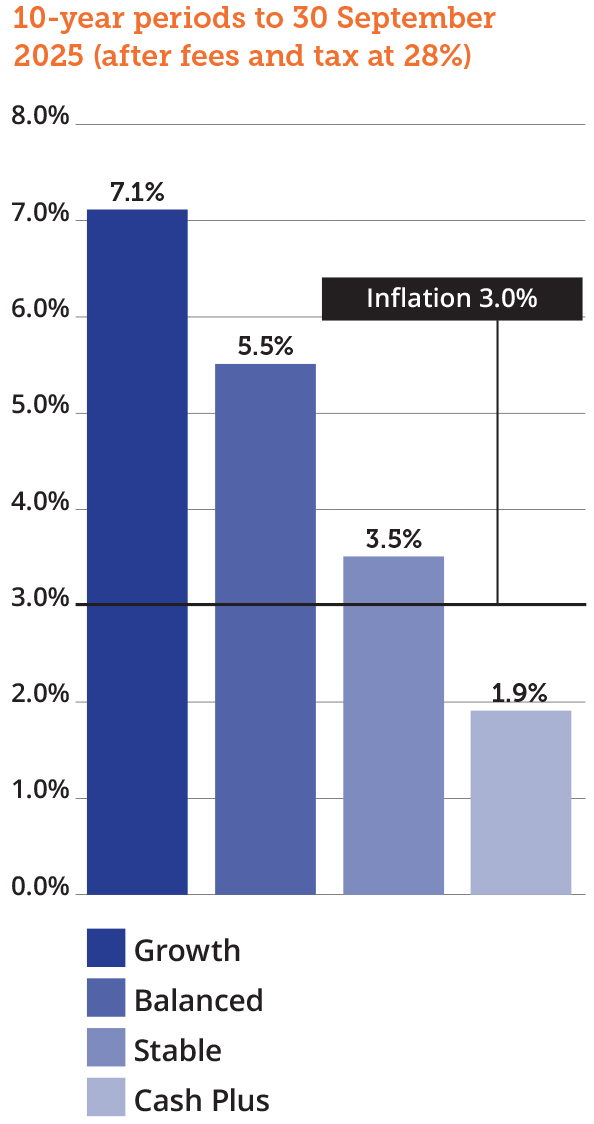
Performance vs inflation
Updated quarterly
This graph shows average PSS returns over 10 years against inflation over the same period.
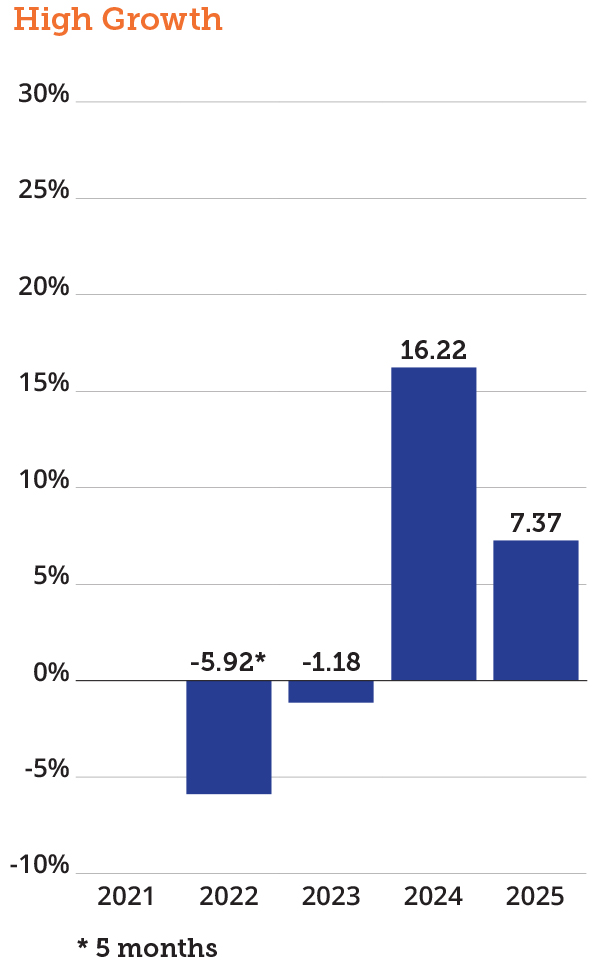
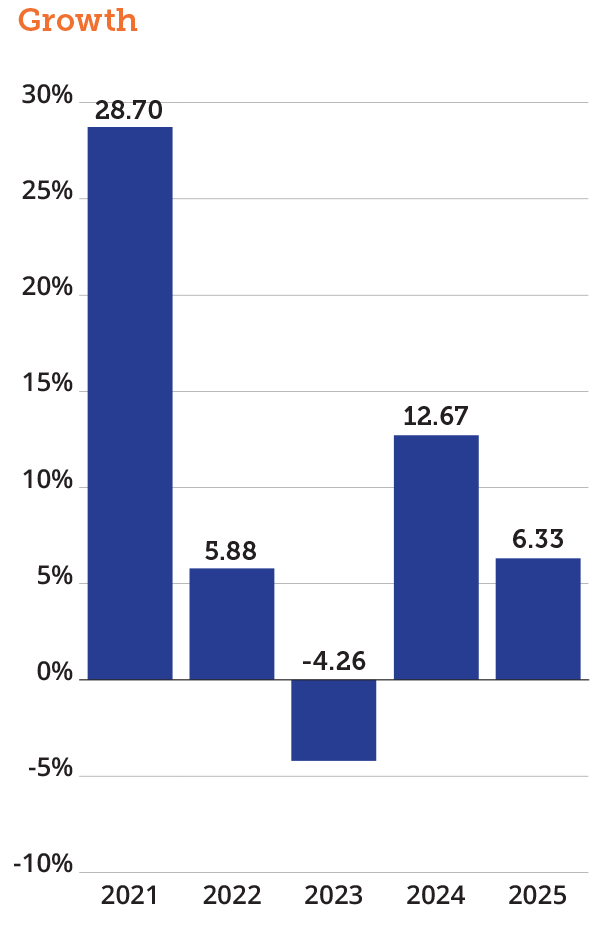
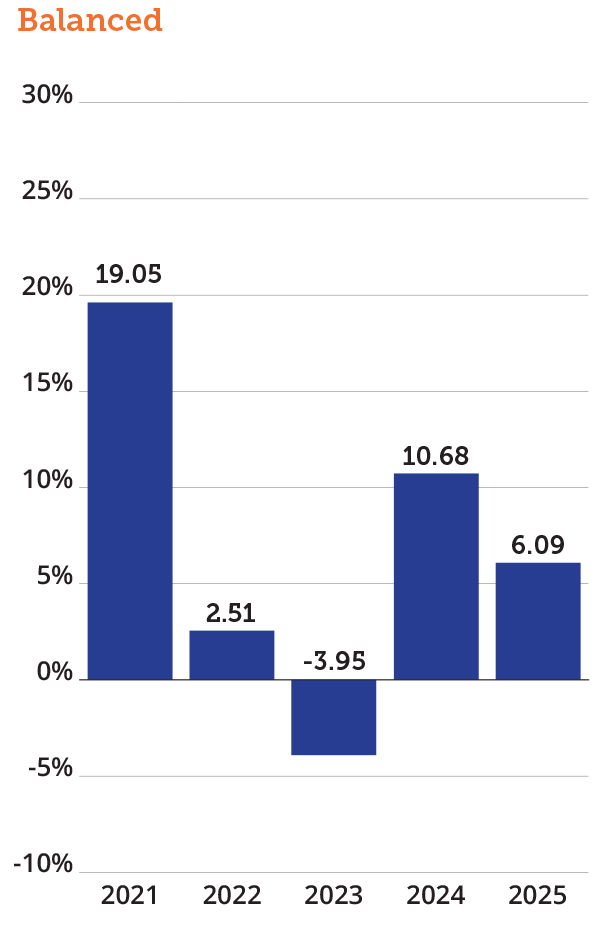
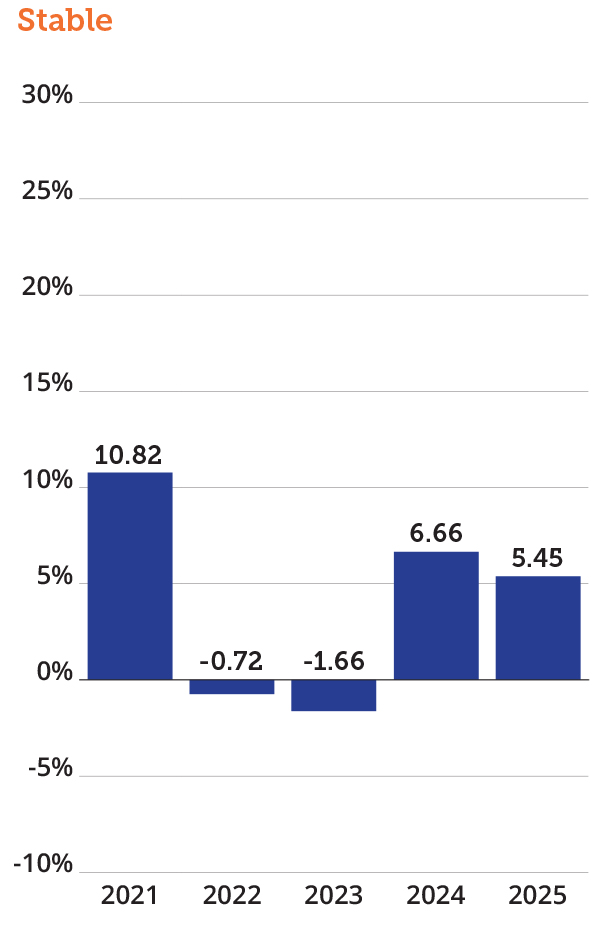
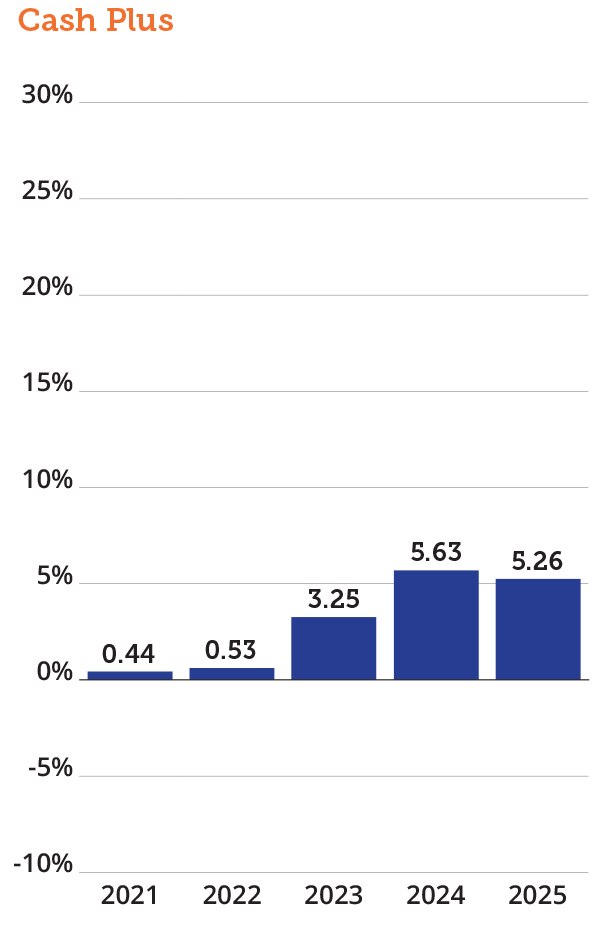
Historical returns
Updated annually
Returns after fees and before tax for years ended 31 March. High Growth was introduced in November 2021.