Investment review - September 2025 quarter
Overview of investment markets for the quarter ended 30 September 2025 from our investment manager, Mercer. All returns in the following commentary are in local currency terms, unless stated otherwise.
Market summary
Global economic activity in Q3 remained resilient despite signs of slowing momentum in several major economies. The United States continued to anchor global growth, supported by robust consumer spending and business investment in AI and technology infrastructure. Inflation continued to ease gradually, allowing the Federal Reserve to deliver its first rate cut of the cycle in September, cutting interest rates by 25bps to 4.25%. In Europe, growth stayed subdued but avoided contraction, while China’s targeted stimulus measures began to stabilise manufacturing and property activity, offering modest relief to broader Asian markets. The MSCI World (local currency) rose 7.5%, though was outperformed by the MSCI Emerging Markets index (local currency), which gained 12.2%. Several investments in the US tech sector saw the Magnificent 7 shares (Apple, Microsoft, Amazon, Alphabet, Meta, Tesla, and Nvidia) rise by 17.6% during the quarter.
New Zealand economic growth slowed significantly in Q2, as GDP fell by -0.9% QoQ in Q2’25, below market expectations of -0.3% QoQ. The Reserve Bank of New Zealand (RBNZ) reduced interest rates by 25 basis points to 3.0%, signalling the possibility of further easing amid a slowing economy and ongoing external challenges. The unemployment rate increased to 5.2% in Q2, up from 5.1% previously. These figures confirm the weak GDP data and support the RBNZ’s shift in outlook.
US Treasuries ended the quarter lower, after yield‑curves initially steepened driven by rate‑cut expectations and concerns over Fed independence. However, the market had fully priced a 25bps cut to 4.00–4.25% by September and easing dissent helped reverse the steepening. Eurozone yields rose as tariff uncertainty faded and Germany’s fiscal stimulus improved the macroeconomic outlook, while French bonds lagged amid political fragmentation and a Fitch downgrade from AA‑ to A+. Credit outperformed sovereign bonds during the quarter as US investment‑grade spreads tightened to multi‑decade lows, boosted by solid earnings and strong demand that absorbed renewed issuance.
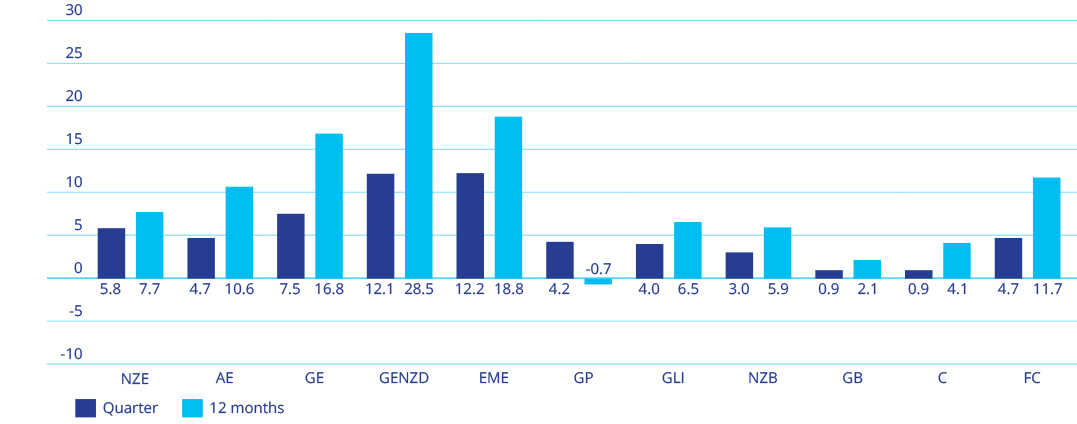
This chart shows the returns of various market indices for periods ending 30 September 2025. Key: NZE New Zealand equities; AE Australian equities; GE Global equities (local currency); GENZD Global equities (NZ dollars); EME Emerging market equities local currency; GP Global property hedged; GLI Global listed infrastructure; NZB New Zealand bonds; GB Global bonds aggregate hedged; C New Zealand cash; FC Foreign currency effect. The foreign currency effect is the difference between the unhedged and hedged overseas share returns.
Sector commentaries
Trans-Tasman equities
New Zealand equities were up 5.8% in Q3, on the backdrop of easing rates. The RBNZ opted to cut the OCR by 25bps in September, with markets pricing in further cuts in October, bottoming out at 2.25% by the end of 2025. Alongside this, most sectors recorded gains. Materials delivered the strongest performance; rising 24.7%, as metal prices surged. Information technology was the weakest sector; declining by -4.2%.
Global equities
Markets were buoyed by two main drivers: robust corporate earnings and surprisingly sturdy economic data (especially in the US), where growth stocks outpaced expectations. That momentum, together with expectations of interest-rate cuts, pushed stocks to fresh highs through September, with emerging markets leading the gains. Developed Market equities (MSCI World (local currency)) rose by 7.5% in Q3’25, despite disappointing US economic data. Several investments in the US tech sector saw US equities (MSCI US (local currency)) continue to climb (+8.0%). This was driven by the “Mag 7” (Apple, Microsoft, Amazon, Alphabet, Meta, Tesla, and Nvidia), which rose by 17.6% during the quarter. Emerging market shares (MSCI EM (local currency)) rose 12.2%, driven by a 19.8% rise in the Chinese equities (MSCI China (local currency)) during the quarter.
Property & listed infrastructure
International listed property was higher, up 4.2%; and international listed infrastructure was up 4.0% over the quarter. The resumption of the US easing cycle was a boost to the sector, with softening lending conditions providing support. The NZX All Real Estate was up a significant 14.6% over the quarter as OCR cuts boosted investor optimism.
NZ bonds and cash
New Zealand bond valuations rose in Q3’25, as sovereign bond yields fell sharply following the poor economic growth data released in the quarter. Yields also faced downwards pressure from the RBNZ’s easing cycle, as lower interest rates drove down yields. NZ 10- year yields fell 36bps over the quarter, while the 2-year swap rate fell 74bps. The NZ Bond market (Bloomberg NZ Bond Composite 0+ Yr Index (local currency)) was up 3.0% and NZ Cash (S&P/NZX Bank Bills 90-Day Index) was up 0.9% over the quarter.
Global bonds
International government bonds gained in Q3, as US Treasury yields ended lower after expectations for rate‑cuts increased and were priced into markets. Meanwhile, UK, German and Japanese yields rose amid fiscal and political pressures; credit markets outperformed, with investment‑grade spreads tightening to multi‑decade lows and broad-based positive returns across regions. Sovereign Bonds (Bloomberg Global Aggregate-Hedged (NZD)) rose 0.9% during the quarter.
This information has been prepared by Mercer (N.Z.) Limited (Mercer) for general information only. The information does not take into account your personal objectives, financial situation or needs. Before making any investment decision, you should take financial advice as to whether your intended action is appropriate in light of your particular investment needs, objectives and financial circumstances. Neither Mercer nor any related party accepts any responsibility for any inaccuracy. Past performance is no guarantee or indicator of future performance.